10 Supply Chain KPIs and Metrics You Should Track to Improve Efficiency [+Examples]
In a volatile global environment marked by increasing customer expectations and inevitable disruptions, managing supply chains requires a fine-tuned blend of speed and accuracy. The margin for error is slim, and missteps can trigger a chain reaction of negative consequences.
The stakes have never been higher — a recent PwC survey revealed that only 37% of companies have changed their supply chain operating models in the past year despite increasing demands for agility and efficiency. Meanwhile, Gartner’s research emphasizes the need to invest in technological advancements to stay competitive, with 58% of business leaders identifying it as a top priority in the coming years.
Supply chain leaders need information that they can use to make improvements. Key Performance Indicators (KPIs) are a crucial part of this data-driven approach, offering the visibility and metrics necessary to make informed decisions, improve operations, and meet customer expectations.
What are supply chain KPIs?
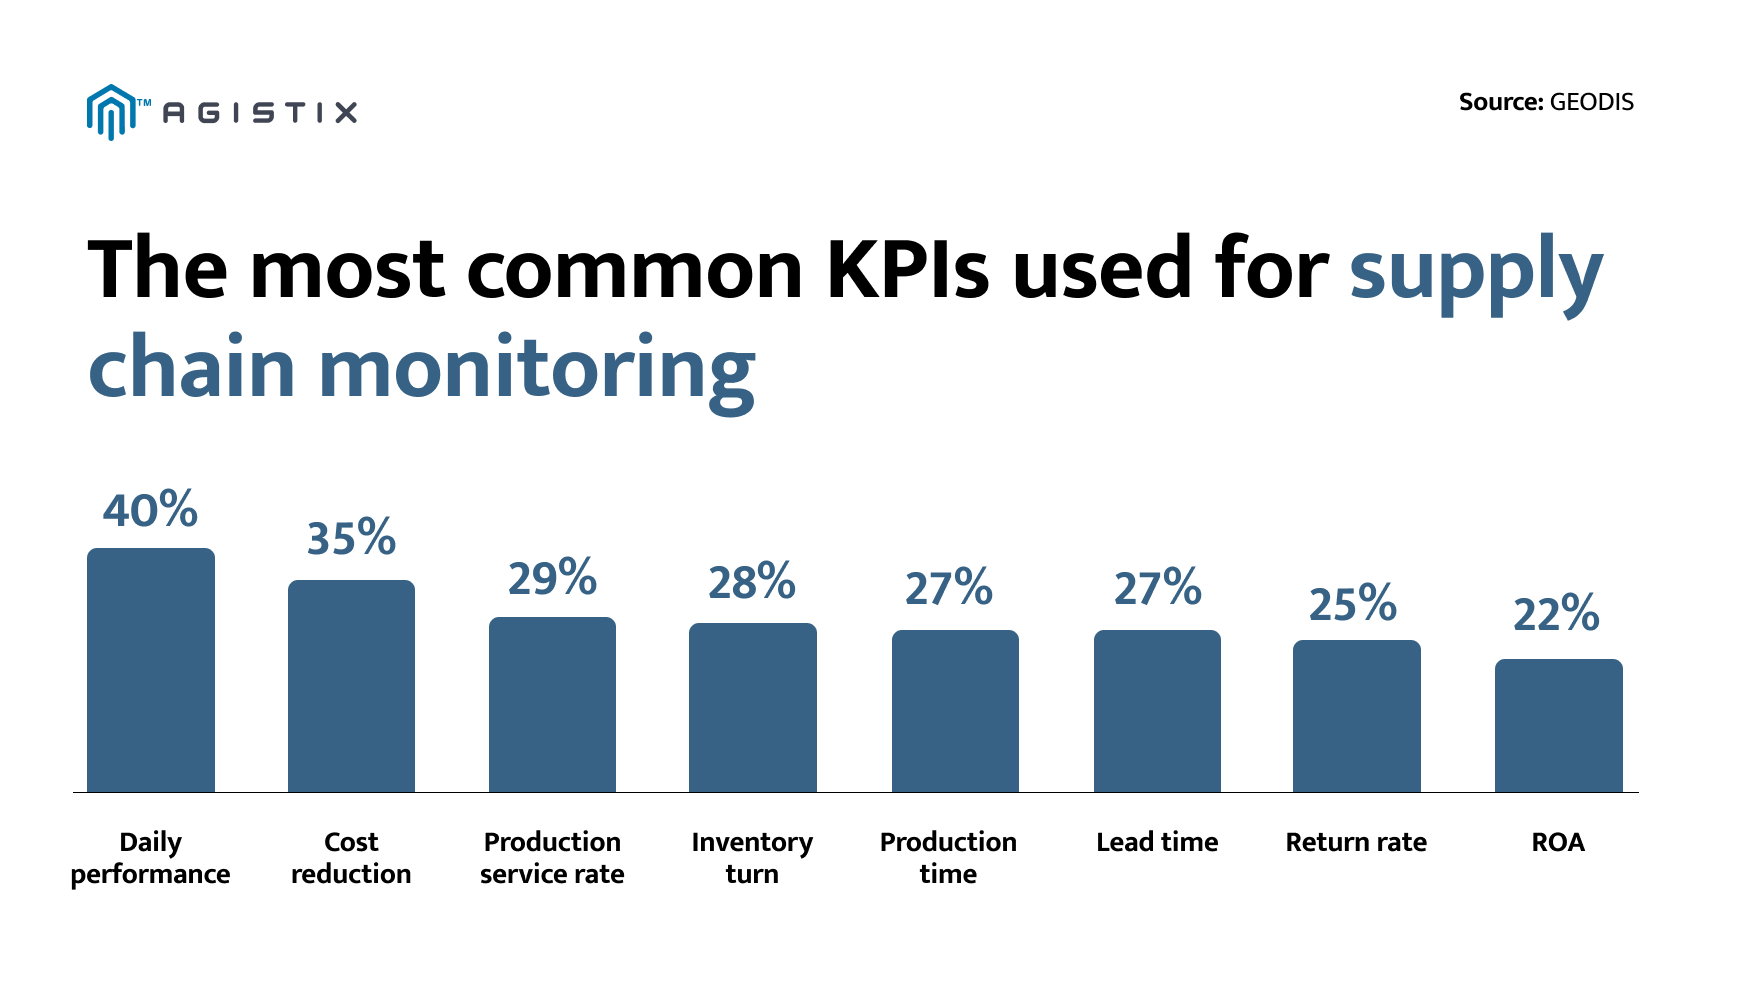
KPIs in supply chains are vital signs of an operation’s health. They offer a quantitative pulse check, highlighting strengths, diagnosing bottlenecks, and measuring progress toward business goals. The insights businesses gain from monitoring KPIs allow for proactive responses to disruptions, informed optimization strategies, and benchmarking against industry standards.
The most common supply chain management KPIs, as shown below, provide important evidence of the supply chain’s success, or conversely, areas that require attention.
Types of supply chain KPIs
Supply chain KPIs and metrics form a powerful source of information for understanding and improving day-to-day operations. Yet, with so many variables, businesses should understand the different types of KPIs and which are most useful for their own circumstances. For example:
Monitoring KPIs are real-time metrics that track the ongoing performance of specific processes, providing immediate output feedback and identifying potential bottlenecks or disruptions. This includes tracking the order cycle time and the duration from order placement to delivery, which can reveal inefficiencies in order processing, inventory allocation, or transportation.
Leading KPIs help monitor supplier performance ratings and provide insights into future trends and potential issues, assisting businesses to identify potential risks of delays or quality issues in advance.
Lagging KPIs measure the total impact of supply chain activities, offering a broader view of performance over time.
Understanding the different categories of KPIs in the supply chain helps businesses build a comprehensive performance operations measurement system.
Critical supply chain KPIs for efficiency improvement
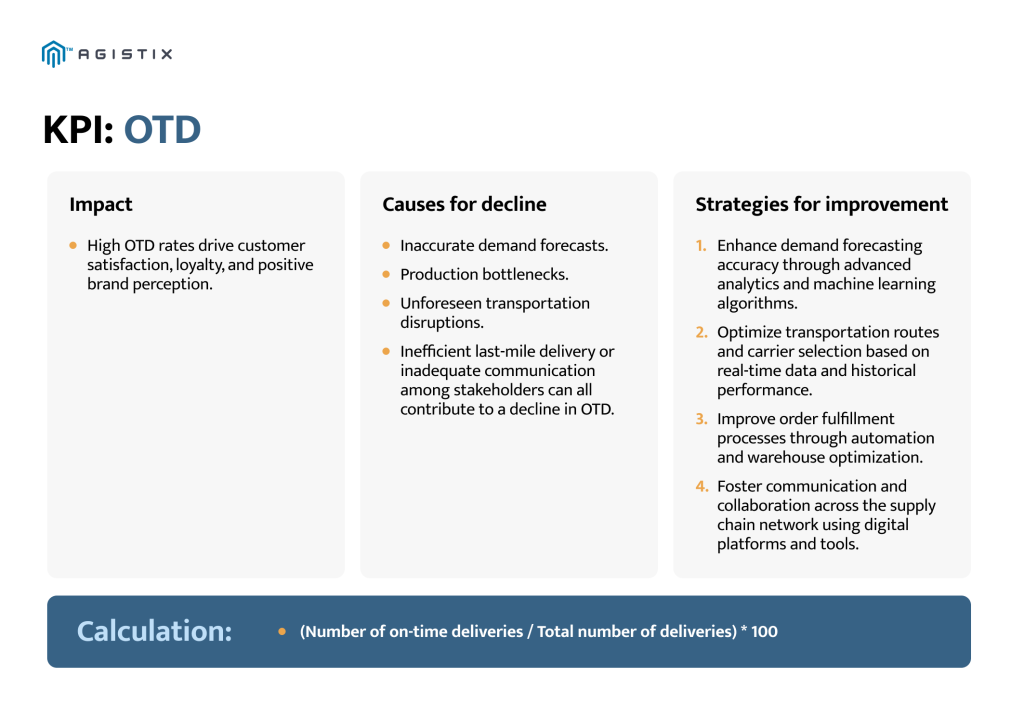
KPI #1: On-Time Delivery (OTD)
In the age of Amazon, where next-day shipping is expected, on-time delivery (OTD) is a must for customer loyalty and brand reputation. A late delivery can quickly turn a happy customer into a frustrated one, leading to lost sales and negative reviews.
OTD measures the percentage of orders delivered on or before the customer’s requested or promised delivery date. It’s a direct reflection of a supply chain’s reliability, but how can one ensure the supply chain consistently delivers on its promises?
Actively monitoring OTD metrics, identifying root causes of delays, and implementing data-driven improvement strategies help boost customer satisfaction, reduce costs, and build a reputation for reliability.
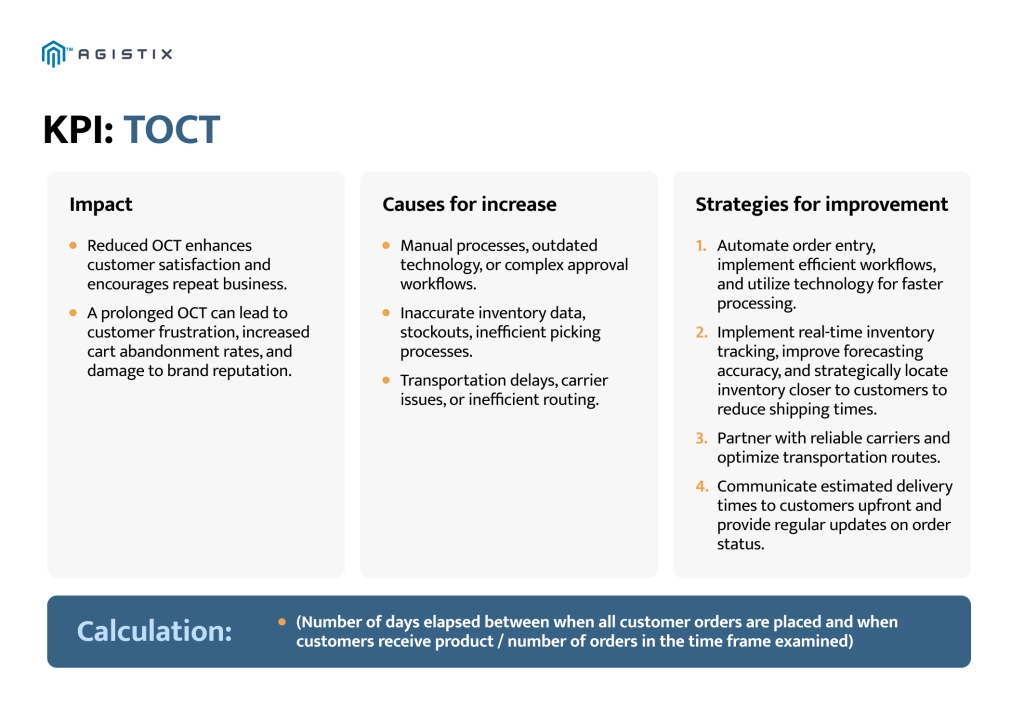
KPI #2: Total Order Cycle Time (TOCT)
TOCT measures the average time it takes for a customer to receive their order after placing it, including the delivery time.
Reducing the total time it takes to process and deliver an order is a must for boosting customer happiness. Businesses that shorten this duration improve the customer experience, which in turn increases sales and profits.
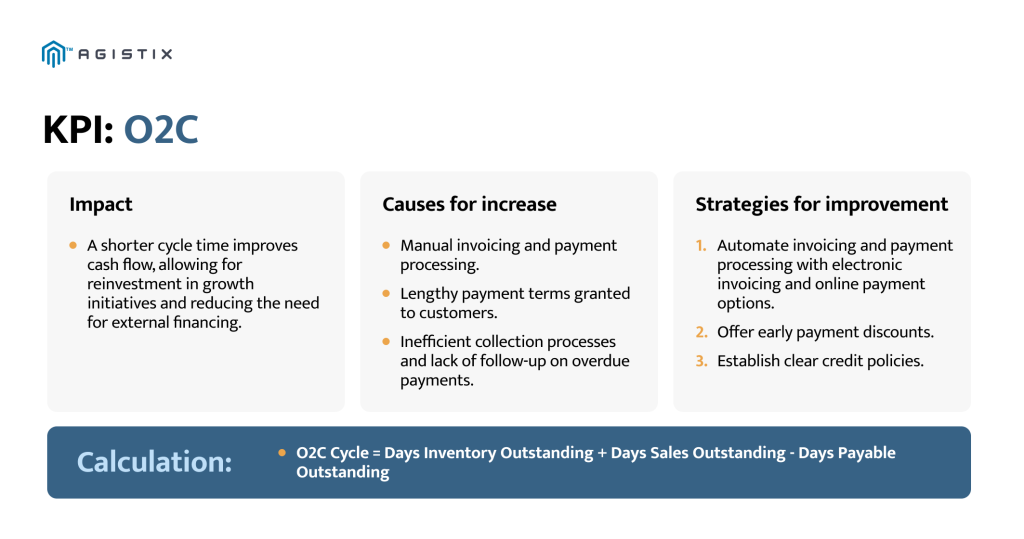
KPI #3: Order-to-Cash Cycle Time (O2C)
Order-to-cash (O2C) cycle time measures how quickly an organization converts orders into cash, a vital indicator of a company’s financial health. This KPI measures the time it takes for a company to receive payment for an order after it has been shipped.
Day Sales Outstanding, or DSO, is a critical component of the O2C cycle, reflecting the average time it takes to collect payments from customers. A high DSO can indicate challenges in revenue collection and potential bad debts, impacting overall cash flow. By actively monitoring and managing DSO, along with the other components of the O2C cycle, businesses can optimize their financial performance and ensure a healthy cash flow.
A reduced time in the O2C cycle indicates a productive supply chain. Enhancing billing, payment, and receivables processes can boost cash flow.
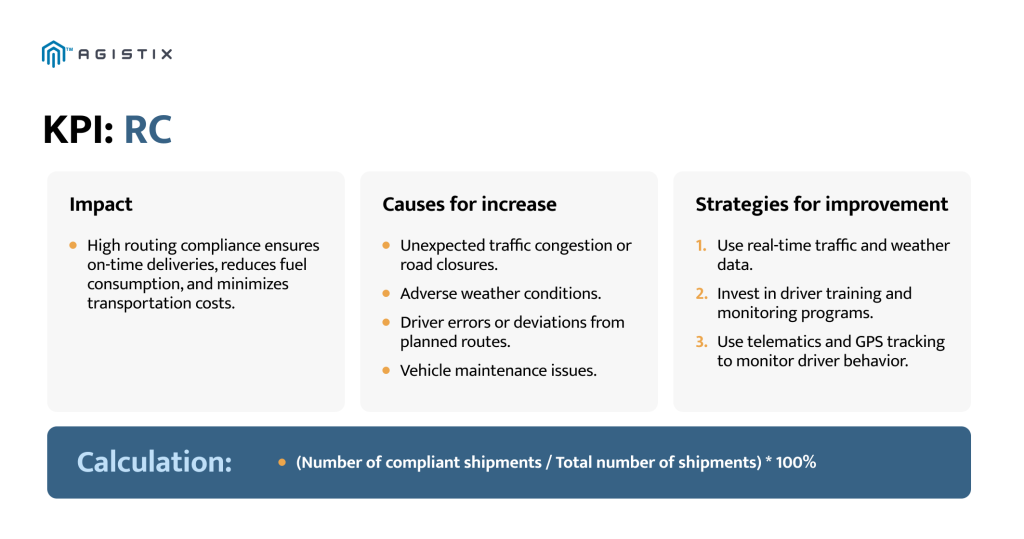
KPI #4: Routing Compliance (RC)
Routing compliance measures the percentage of shipments that adhere to the planned route and delivery schedule. It’s a key factor in on-time deliveries and overall transportation cost management.
A company should adopt a forward-thinking attitude toward route planning and supervision to ensure high levels of routing compliance.
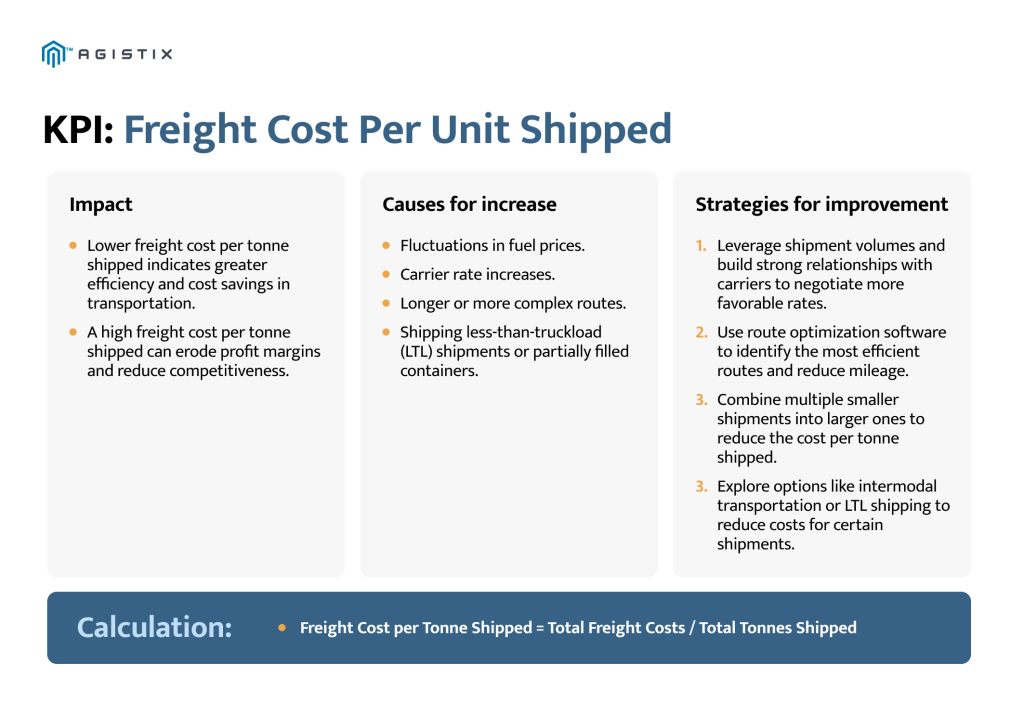
KPI #5: Freight Cost Per Unit Shipped
The freight cost per unit shipped KPI determines the efficiency and cost-effectiveness of your transportation operations. By tracking this, companies can negotiate better rates with carriers and reduce overall shipping expenses.
Tracking freight cost per tonne shipped is essential for optimizing transportation operations and maximizing profitability. By understanding the factors influencing this cost and actively implementing optimization strategies, businesses can achieve savings and boost efficiency, a significant aspect in the current market where transportation costs are on the rise.
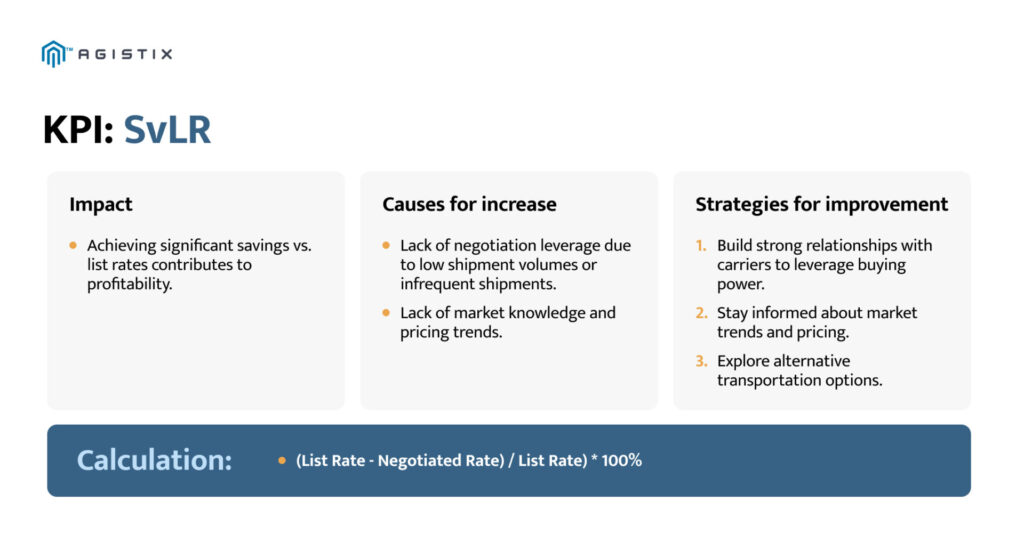
KPI #6: Savings vs. List Rates (SvLR)
Savings vs. list rates is a KPI that measures a company’s ability to secure favorable pricing with carriers and logistics providers. It compares the actual rates a company pays for transportation and logistics services with the published list rates.
Companies can substantially lower transportation and logistics expenses through proactive negotiation and by securing advantageous rates.
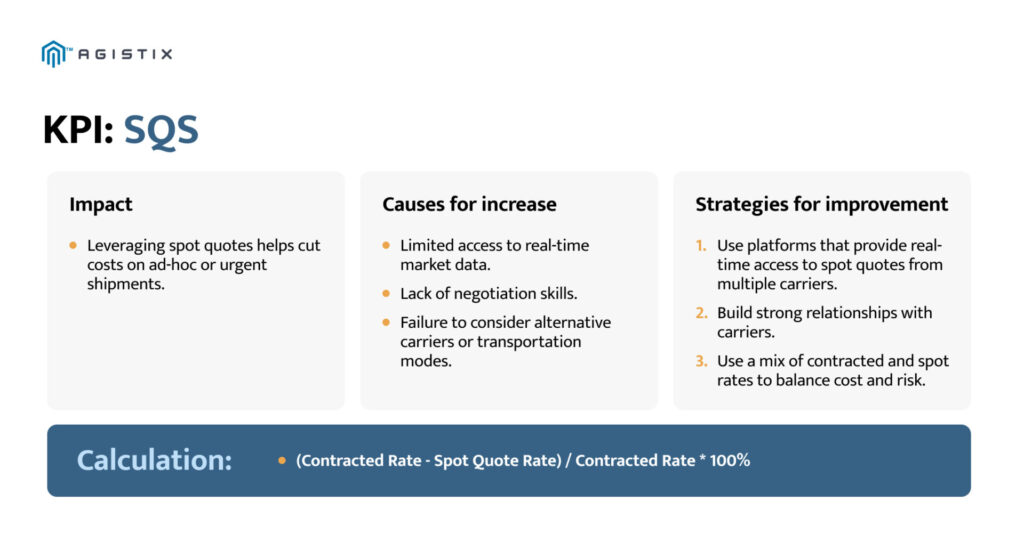
H3: KPI #7: Spot Quote Savings (SQS)
Spot quotes help seize opportunities for cost savings on ad-hoc or urgent shipments. This KPI measures a company’s ability to use the spot market to its advantage.
Spot quote savings are valuable for optimizing transportation costs, especially for businesses with flexible shipping needs. However, it’s important to use spot quotes strategically and balance them with contracted rates to ensure long-term stability and cost control.
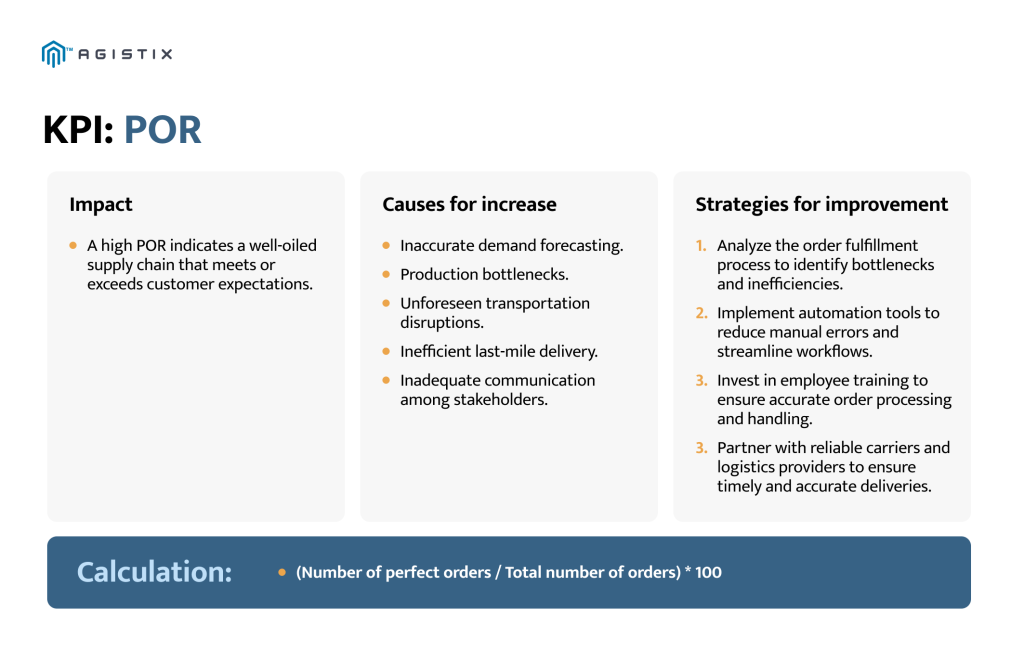
KPI #8: Perfect Order Rate (POR)
The perfect order rate is the gold standard of supply chain efficiency. It measures the percentage of orders that are processed, fulfilled, and delivered without any errors, delays, or customer complaints.
By diligently monitoring and optimizing POR, businesses can ensure a seamless customer experience, build trust, and drive revenue growth.
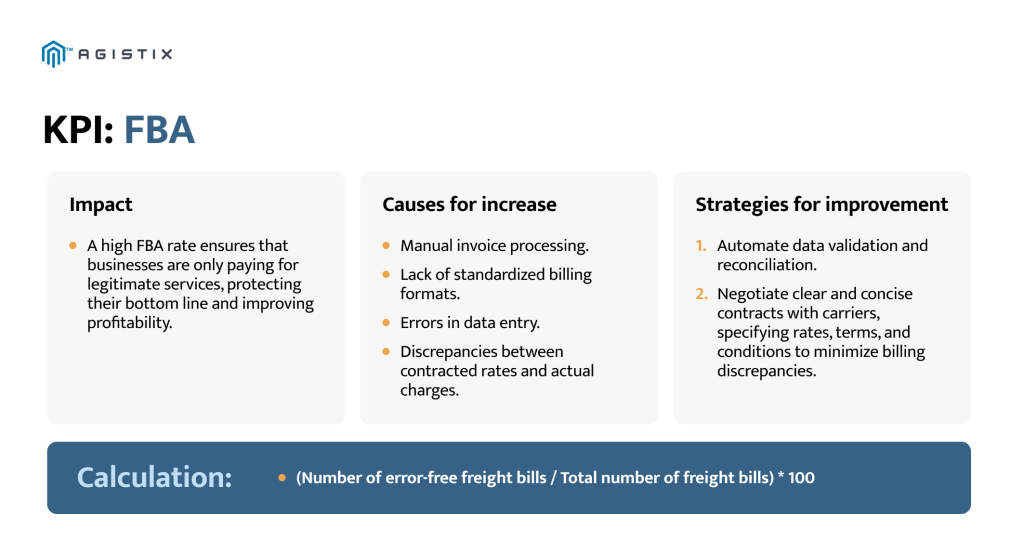
KPI #9: Freight Bill Accuracy (FBA)
Freight bill accuracy (FBA) measures the percentage of freight invoices that are accurate and error-free.
Businesses can avoid unnecessary spending by ensuring high freight bill accuracy, improving carrier relationships, and enhancing their overall financial performance.
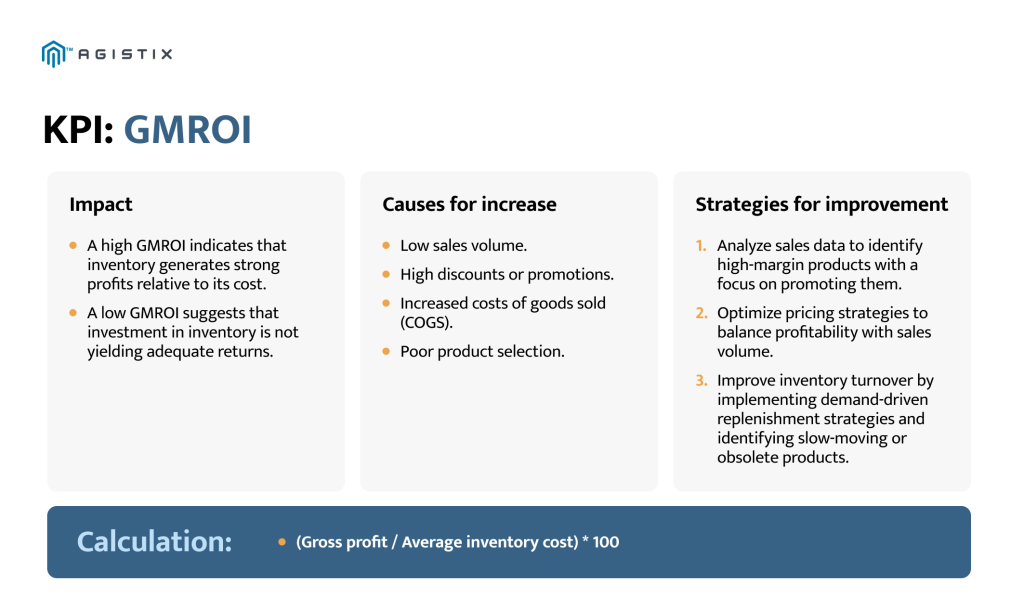
KPI #10: Gross Margin Return on Investment (GMROI)
With inventory management, simply tracking costs and sales isn’t enough. To truly calculate the effectiveness of inventory investment, a company needs GMROI, a metric that connects profitability to the capital tied up in stock. It shows which products generate profit and which simply take up storage space.
Proactively managing GMROI helps make insightful changes that turn inventory from a cost center into a profit generation opportunity.
Strategic planning and supply chain KPIs
A successful supply chain strategy begins by clearly defining desired outcomes. In other words, strategic planning guides organizations toward their business goals while navigating the inevitable obstacles.
KPI alignment: Whether the goal is cost reduction, enhanced customer satisfaction, improved supply chain efficiency metrics, or sustainability, KPIs provide measurable benchmarks for progress. By monitoring relevant KPIs, organizations gain insights into their performance against these objectives and identify areas that require attention.
Dynamic adaptation: Market fluctuations, disruptions, and emerging technologies present new challenges and opportunities. A smart strategy must be dynamic, requiring ongoing evaluation and adjustment of KPIs to remain aligned with evolving goals.
Continuous improvement: High-performing teams foster a culture of continuous improvement by integrating data-informed decisions into each process. They regularly review KPI data, identify areas for improvement, and launch targeted initiatives.
Agile and data-centric approach speeds up decision-making, empowers companies to anticipate disruptions, and contributes to enduring excellence across their operations.
Supply chain KPI monitoring and analysis tools: empowering operational excellence
Managing supply chains effectively requires up-to-the-minute information and smart conclusions based on data. The volume of data generated can be overwhelming, but robust monitoring and analysis tools provide the information to spot issues and improve processes.
Tracking systems
Tracking systems provide the building block for supply chain visibility. Employing technologies like GPS, RFID, and IoT sensors, these systems monitor the real-time movement of goods, delivering accurate information on location, ETA, and potential delays. Apart from standard location tracking, advanced systems offer a deeper understanding of carrier performance, route optimization, and even the environmental impact of transportation, allowing for cost reduction and improved customer service.
Performance indexes
Performance indexes provide a snapshot of operational effectiveness against key metrics like on-time delivery, order fill rate, inventory turnover, and customer satisfaction. Tracking these indexes reveals trends, measures the impact of initiatives, and benchmarks performance against industry standards. Setting targets and monitoring progress help organizations stay at peak efficiency and meet customer expectations.
Ratio analysis
Supply chain visibility platforms often incorporate ratio analysis tools. These offer a snapshot of operational effectiveness against key metrics. By calculating crucial ratios, businesses uncover deeper insights into their supply chain’s financial health and operational efficiency. This helps to benchmark performance against industry standards and measure the impact of their strategic initiatives.
The wide selection of supply chain monitoring and analysis tools can be disorienting. When selecting a platform for a specific business, consider the following factors:
Will the solution scale with your business?
Can it seamlessly integrate with your existing systems?
Does it offer intuitive dashboards and reports, making it easy to understand complex data?
Can it be tailored to your specific needs and requirements?
What is the total cost of ownership, and what kind of ROI can be expected?
Agistix: Empowering supply chain performance through data-driven KPIs
Effective supply chain management relies on visibility into in-transit, transactional, financial, and data ownership, with KPIs as success indicators. Agistix’s comprehensive visibility platform empowers businesses to harness the full potential of their data, turning raw KPIs into actionable insights that drive operational excellence.
Agistix consolidates real-time data across the supply chain, providing a unified 360-visibility view. The platform centralizes real-time tracking data across all modes and carriers, providing comprehensive visibility into inbound, outbound, and third-party shipments. Integrating financial data with real-time tracking enables accurate freight spend forecasting, routing guide compliance, and comparing estimated versus actual costs easily.
Ready to take your supply chain to new heights? Experience the power of data-driven decision-making with Agistix — request a free visibility platform demo.
Share
Author
Trevor Read
Trevor Read is the founder and CEO of Agistix, with over two
decades of experience in SaaS, global supply chain, and
logistics technology. Trevor is a results-driven
entrepreneur who is passionate about leveraging big data to
create scalable, fast-deployment solutions that empower
businesses to optimize operations and seize new
opportunities in complex, ever-changing markets.